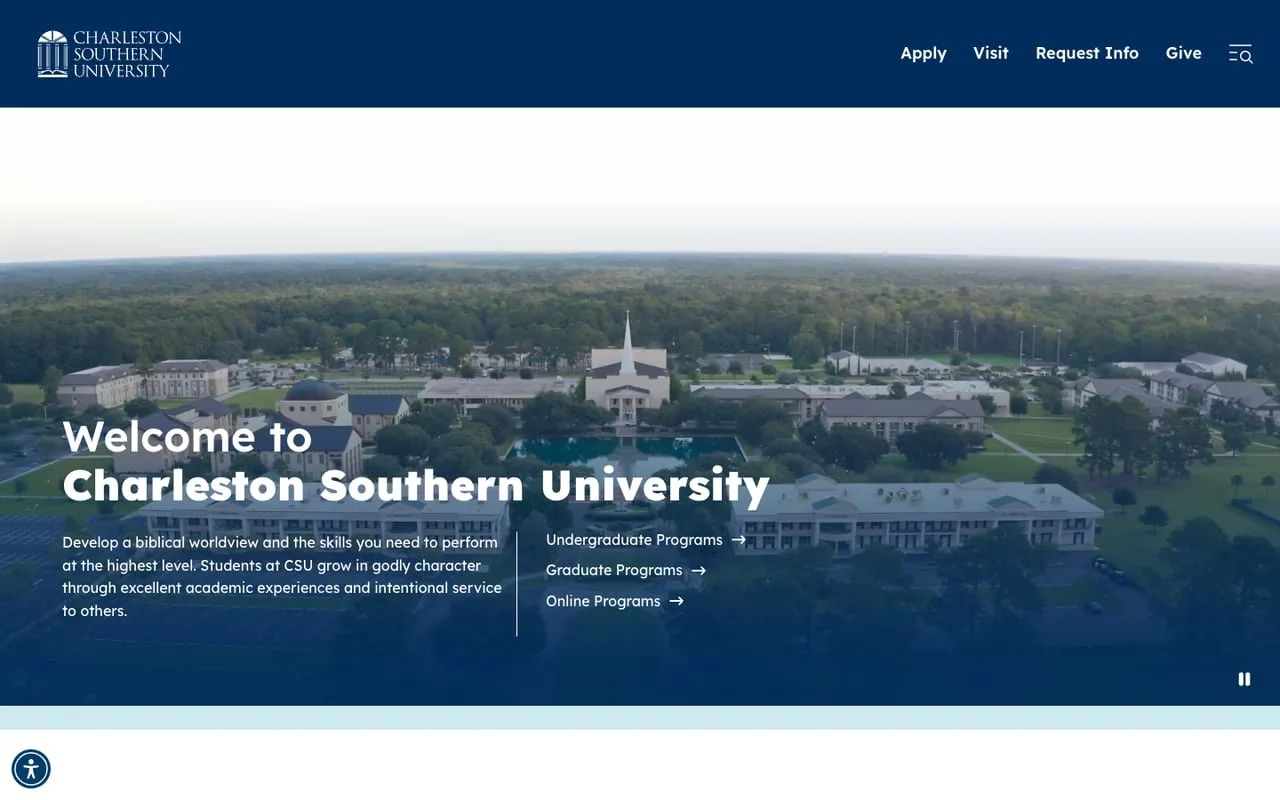
As Web Content Strategist at Charleston Southern (August 2021 – May 2022), I set out to move the university toward content that meets prospective students where they search.
What I did
- Optimized degree program pages: title tags, meta descriptions, headings, and content shaped by the search demand around each program and the careers it leads to.
- Got faculty on board by showing them what prospective students were actually searching for in their fields, and explaining how SEO works.
- Improved site speed and rendering with WordPress plugins.
- Built a tuition calculator, still live, that estimates tuition, fees, and books for 40+ online and graduate programs, factors in transfer credits and military rates, and captures leads by emailing students their estimate.
- Launched a blog with the university’s third-party developers to capture top-of-funnel searches.
Results
Each metric is measured from its low point to its peak during my tenure (August 2021 – May 2022), per Ahrefs. For most metrics, the low point falls in my first days on the job.
| Metric | Low point | Peak | Change |
|---|---|---|---|
| Organic traffic value | $18,187 (Aug 14, 2021) | $131,130 (Mar 30, 2022) | 7.2x |
| Keywords in positions 4–10 | 1,319 (Aug 11, 2021) | 3,068 (Mar 29, 2022) | +132.6% |
| Keywords in the top 10 | 1,698 (Aug 11, 2021) | 3,836 (Mar 30, 2022) | +125.9% |
| Organic traffic | 13,447 (Sep 12, 2021) | 28,768 (Mar 30, 2022) | +113.9% |
| Keywords in the top 3 | 377 (Aug 10, 2021) | 798 (Mar 13, 2022) | +111.7% |
| Total ranking keywords | 28,849 (Sep 10, 2021) | 43,188 (Jan 9, 2022) | +49.7% |
| Referring domains | 1,163 (Aug 22, 2021) | 1,417 (Apr 28, 2022) | +21.8% |
| Domain Rating | 56 (Aug 2021) | 62 (Feb 2022) | +6 points |
Organic traffic dipped from about 15.9K in mid-August to its September low, then climbed steadily. From my first day (15,620 visits), the peak was up 84.2%.
What happened after I left
These results aren’t mine. I left in May 2022, right as the blog launched, and other people ran it from there. What I did was push for the blog in the first place, work with the developers to build it, and set the direction: a blog for top-of-funnel searches, feeding the program pages. That direction is what the university kept.
Here’s how the blog grew from its first month with real traffic (December 2022) to its peak, before the posts moved off the /blog/ folder in October 2025:
| Metric (Ahrefs, /blog/) | Dec 2022 | Peak | Change |
|---|---|---|---|
| Organic traffic per month | 57 | 5,351 (Jul 2025) | 93.9x |
| Traffic value per month | $11.61 | $2,734.79 (Jul 2025) | 235.6x |
| Keywords in the top 3 | 3 | 476 (Sep 2025) | 158.7x |
| Keywords in the top 10 | 11 | 876 (Aug 2025) | 79.6x |
| Total ranking keywords | 207 | 6,226 (Dec 2024) | 30.1x |
| Pages ranking in search | 15 | 127 (May 2025) | 8.5x |
| Referring domains | 0 | 70 (Sep 2025) | from zero |
Growth was steady, not one spike: traffic passed 1,000 a month in December 2023, 2,000 in April 2024, 3,000 in October 2024, and 5,000 in July 2025. Traffic and traffic value are Ahrefs estimates, useful for direction and scale rather than exact visits.
I took the same playbook to Furman, where I launched the blog from scratch and ran it myself. One year in, Furman’s blog had about 60 times the traffic CSU’s had at the same age, from half as many pages. See the Furman content program.
More on the role: Web Content Strategist at Charleston Southern.